In an earlier post I wrote on how price trend and available items have been evolving for The Brothers’ War. This time, I was interested in understanding what the premiums, expressed in price multiplier, was for the different arts of a single card in this set. For this exercise, I always took the price of the nonfoil regular art version as the base price in order to compare it with the foil regular art, nonfoil and foil full art cards. You can read my findings below.
Price and available item multipliers for Cityscape Leveler
What’s a multiplier?
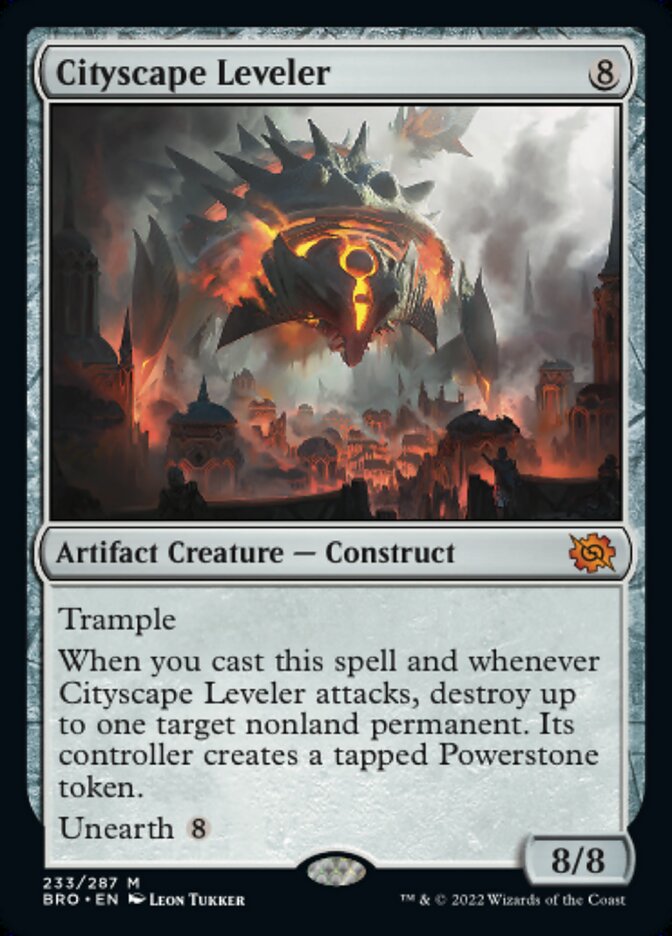
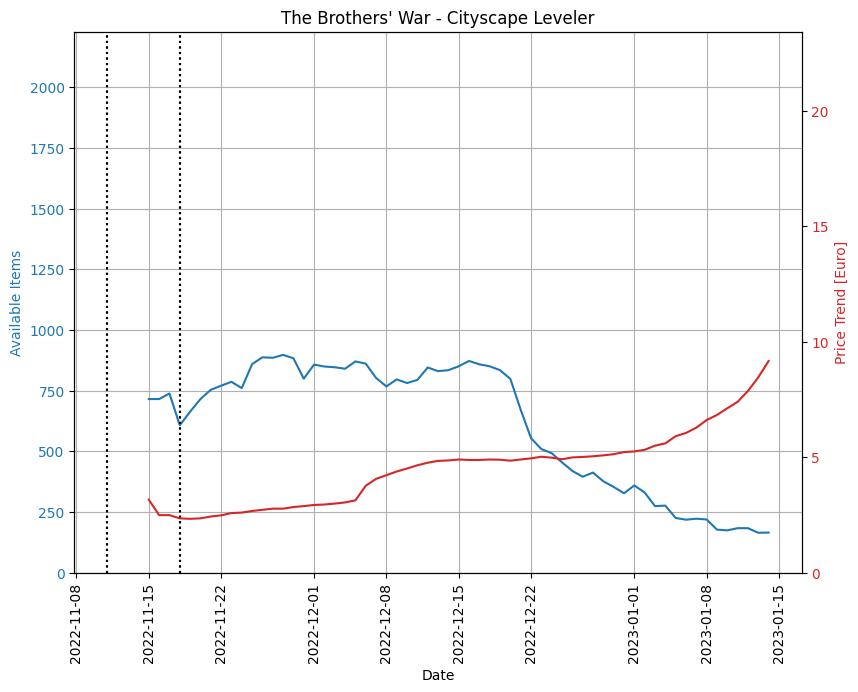
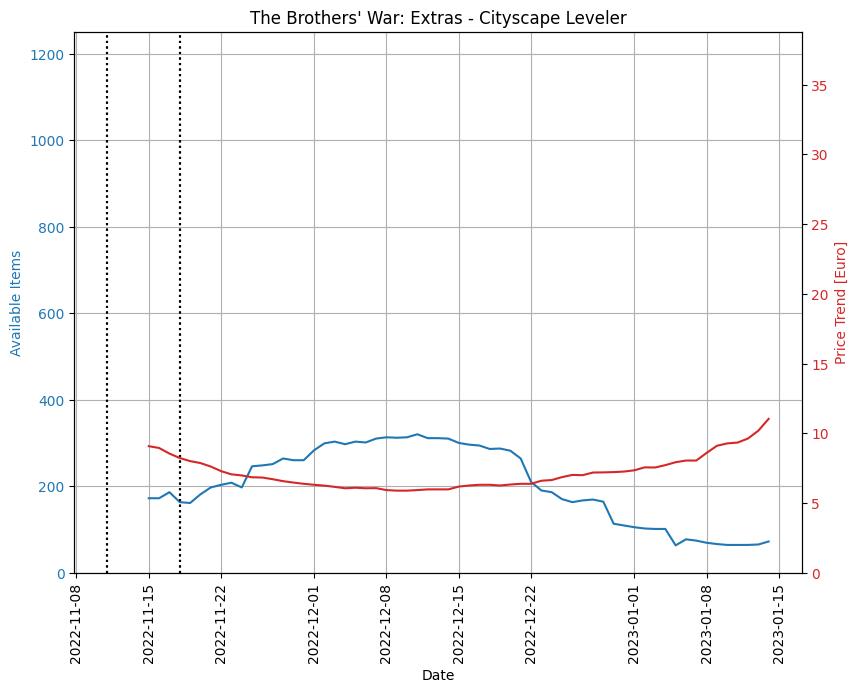
As an example to understand the multiplier and the graphs that follow, I took Cityscape Leveler. This chapter also serves as a shout-out to this card, as there has been a drastic reduction in supply since mid-december ’22. Price trend followed suit in response to the declining amount of available items, reaching about 9 euro on January, 14th, up from 2.5 euros on release weekend.
 |  |
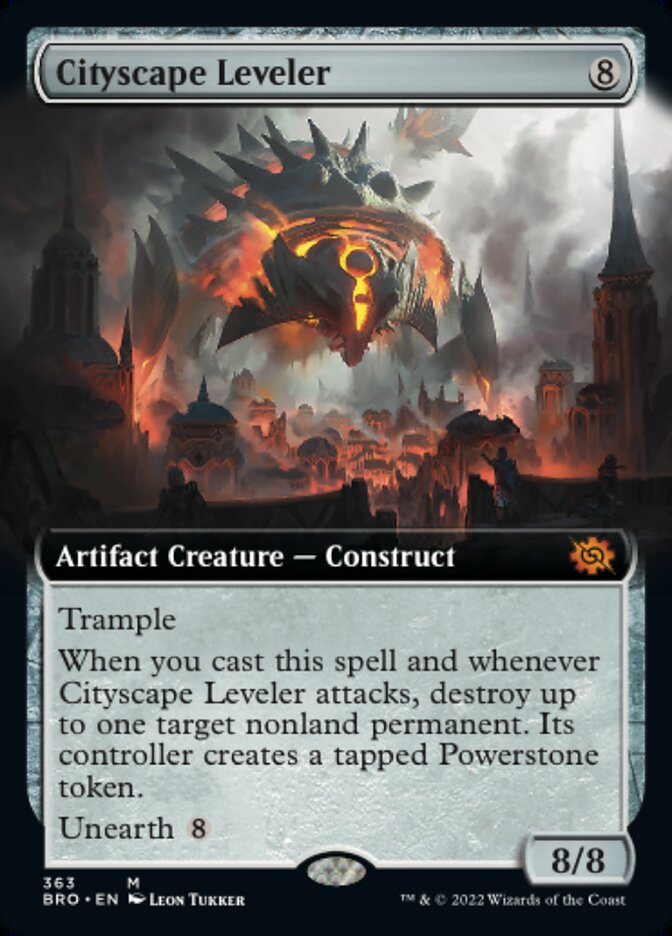
The extended art typically comes at a premium. In the figure below, we see that for the same date, the price was around 11 euro. So we will be paying about 1.2 times more for the extended art version of this card, i.e. the multiplier = 1.2 😉
 |  |
Now, when we have the historical data of these cards, we can evaluate how this multiplier evolves over time.
The same reasoning can be applied in order to calculate the multiplier for the amount of available items.
Calculating multipliers over time
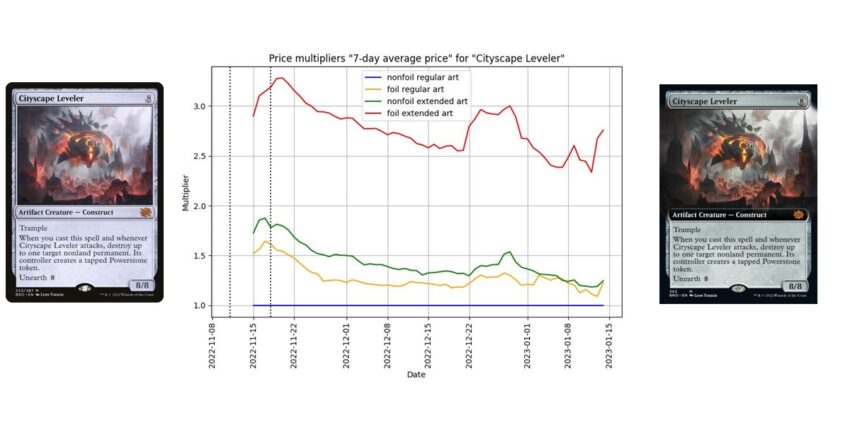
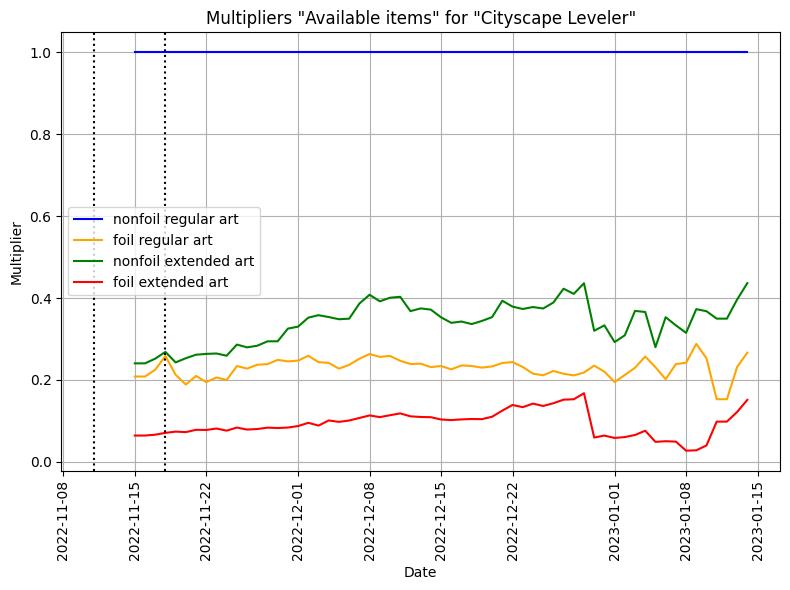
In order to calculate the price multiplier, Cardmarket‘s 7-days average price provided the smoothest price multiplier graph whilst. Other options were to choose from the 1-day price average, 30-days price average or the price trend. But I felt, the 1-day average provided graphs that were too eratic and the other price metrics averaged out too much… That being said, the following figure on the left shows the evolution of the multiplier for the “7-days average price” of Cityscape Leveler and its different arts. The image on the right shows the multiplier for the “available items”.
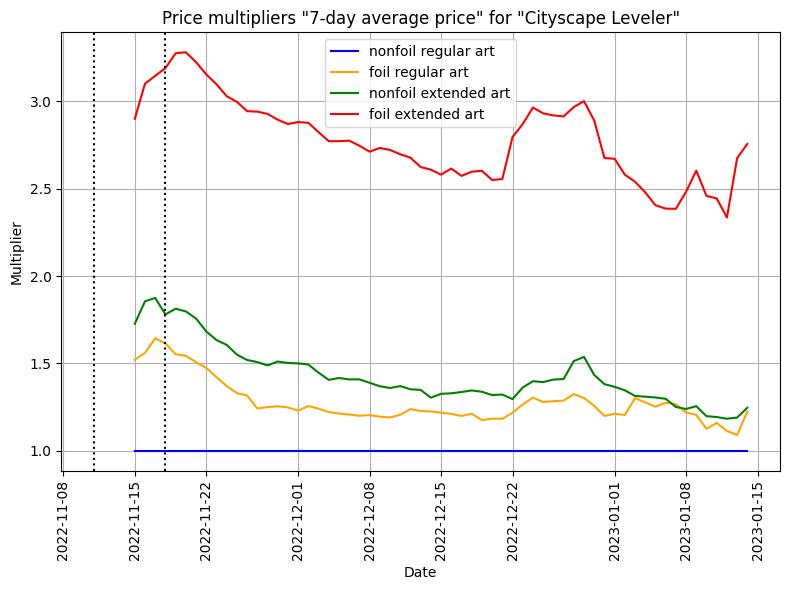 |  |
We notice how the foil extended art is about 2.5x to 3x more expensive than the regular nonfoil art. The nonfoil extended art is in general slightly more expensive then the foil regular art card.
Looking at the available items, the amount of available items of the foil extended art version is about one tenth of the regular nonfoil art.
Multipliers for mythics and rares
What I did next, was to plot all these graphs and aggregated them according to rarity.
Aggregated Plots
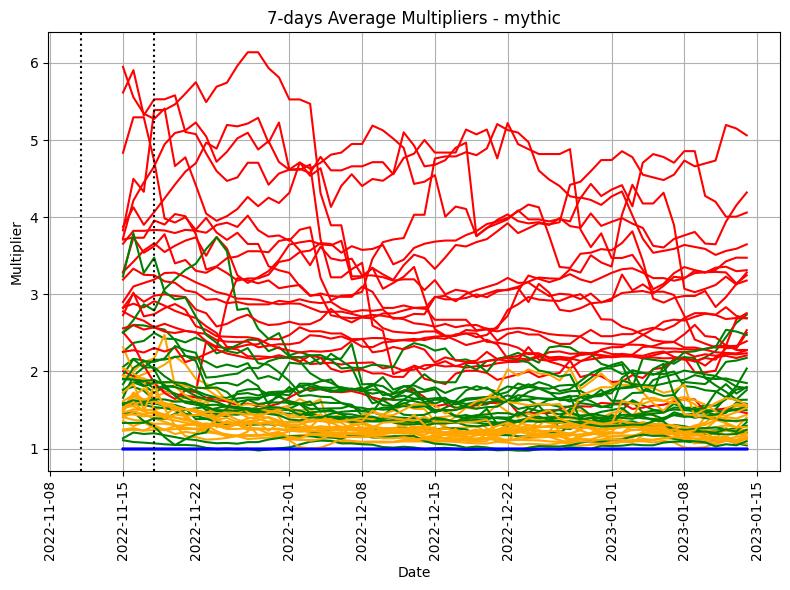
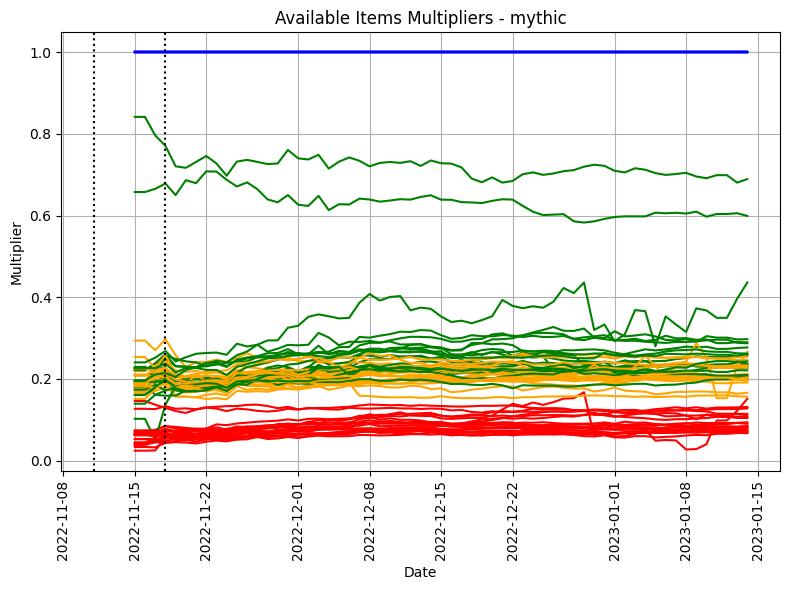
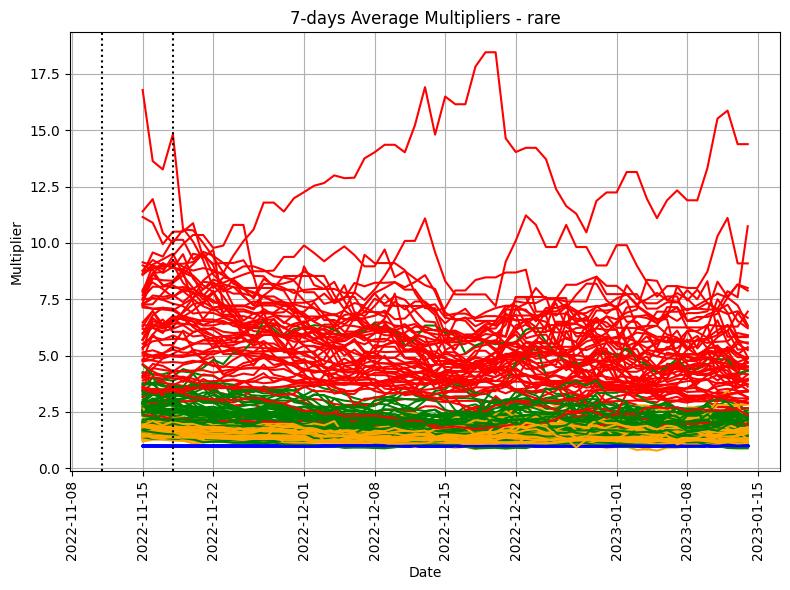
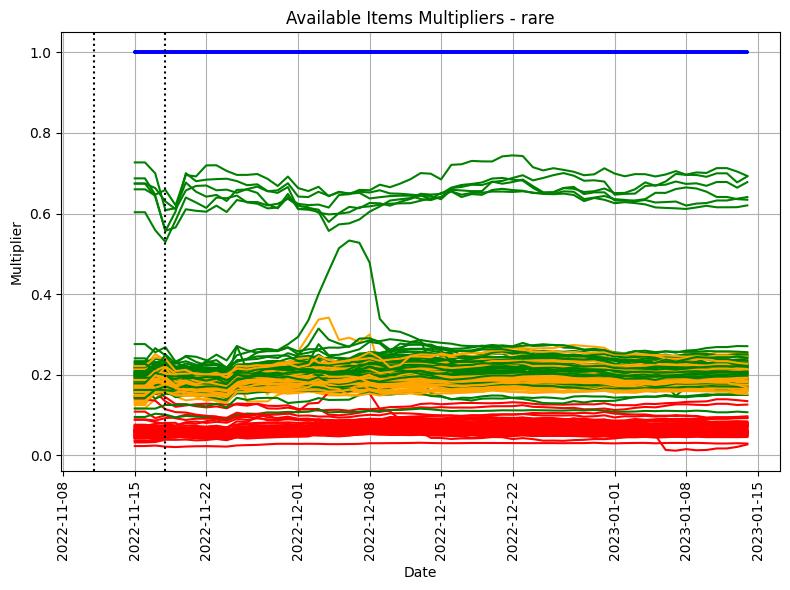
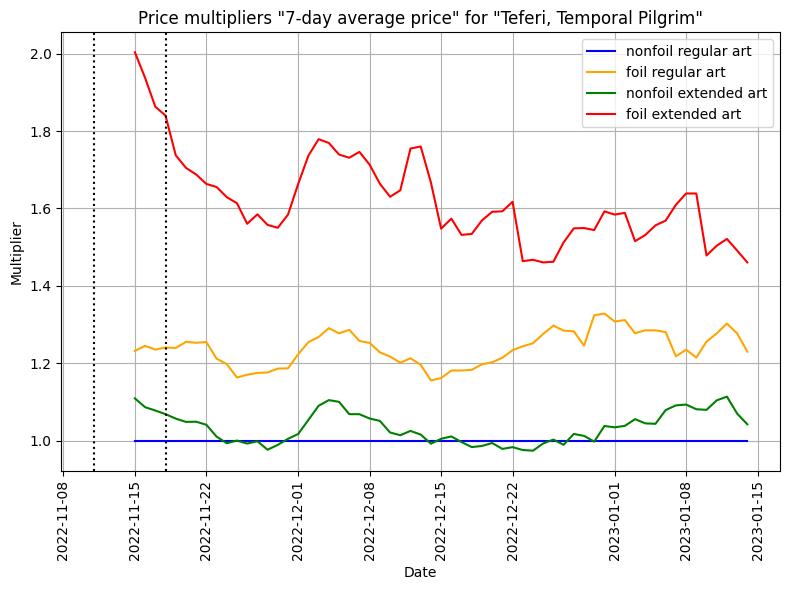
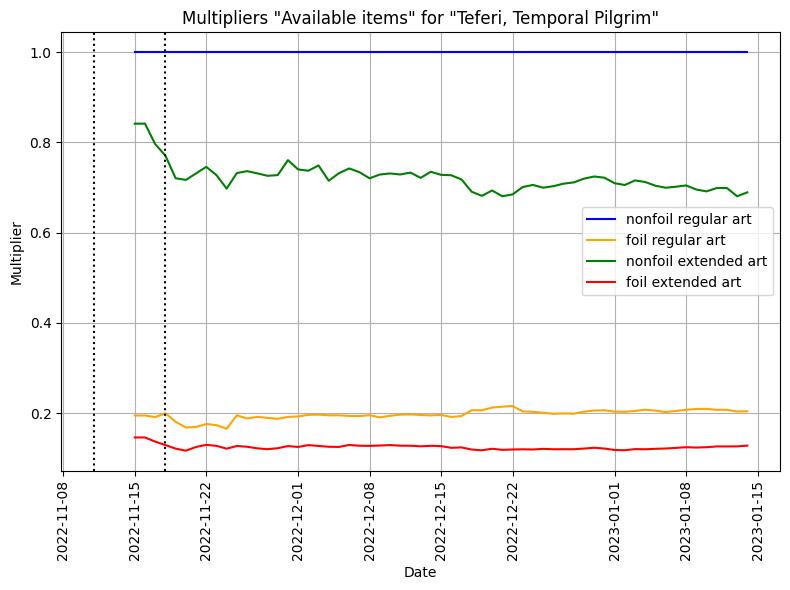
When looking at the aggregated plots, we obtain the following graphs for the mythic and rare cards. The same color coding as for the charts above stand, i.e.: blue for the nonfoil regular art, yellow for the foil regular art, green for the nonfoil extended art and red for the foil extended art. You’ll notice the blue line is always at 1 since we are dividing the values by themselves because the nonfoil regular art is considered to be the reference.
 |  |
 |  |
Mythics
What is more or less visible for the price mulitpliers of the mythic cards is how the foil extended card are worth about 2 to 5 times as much as the nonfoil regular art cards. The nonfoil extended arts are with a multiplier of roughly 1.5x to 2.5x about slightly more valuable then the foil regular arts that are roughly 1x-2x more expensive the nonfoil regular arts. In general, though, the price for the nonfoil extended art is slightly higher then the foil regular. Cf. graphs for Cityscape Leveler above.
Even though the price of the nonfoil extended arts is a bit higher then the foil regular arts, the foil regular arts are less available then the nonfoil extended arts. My conclusion can only be that the extended version has a higher popularity and, hence, a higher demand. Would this equally mean that they will retain their value a bit better?
The 2 “isolated” green lines around 0.8x in the available items multiplier are caused by the borderless planeswalkers and can be seen in more detail below. The legends of the graphs below still refer to these as “extended” arts. My apologies, that is just a quirck of my data analysis tool and I’m too lazy to fix it at this time 😉
 |  |  |
 |  |  |
In contrast to the extended arts, the price of these borderless cards follow a more traditional rule: less available is more expensive.
Rares
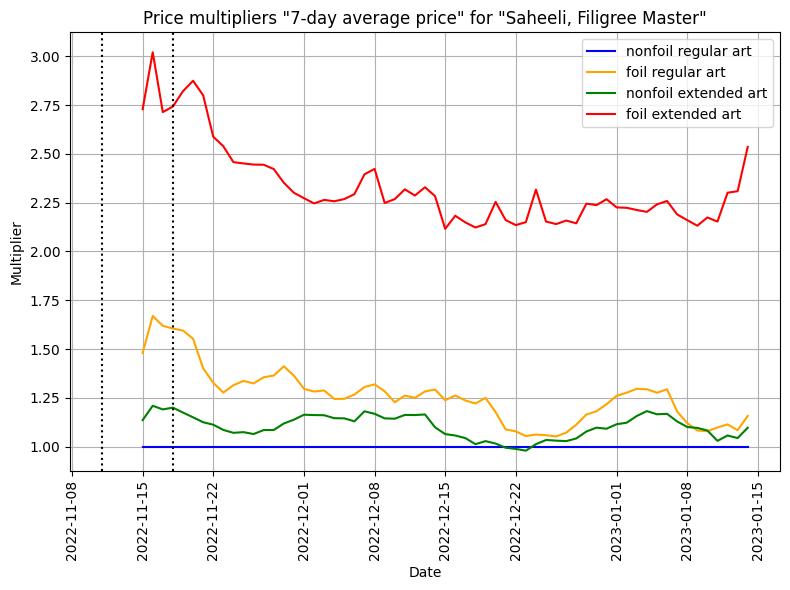
The aggregated and individual plots for the multipliers of rares tell a similar story as those for the mythics. The higher price multiplier with values of 2.5x up to 17x for the foil extended arts do stand out though. Why these rares would command a higher multiplier is not yet clear to me, feel free to put your thoughts in the comments below.
Once again, the “isolated” green lines in the Available Items Multiplier are linked to borderless cards. These are the borderless dual lands (“Battlefield Forge“, “Brushland“, “Llanowar Wastes“, “Underground River“), a borderless “Mishra, Tamer of Mak Fawa” and a borderless “Urza, Prince of Kroog“.
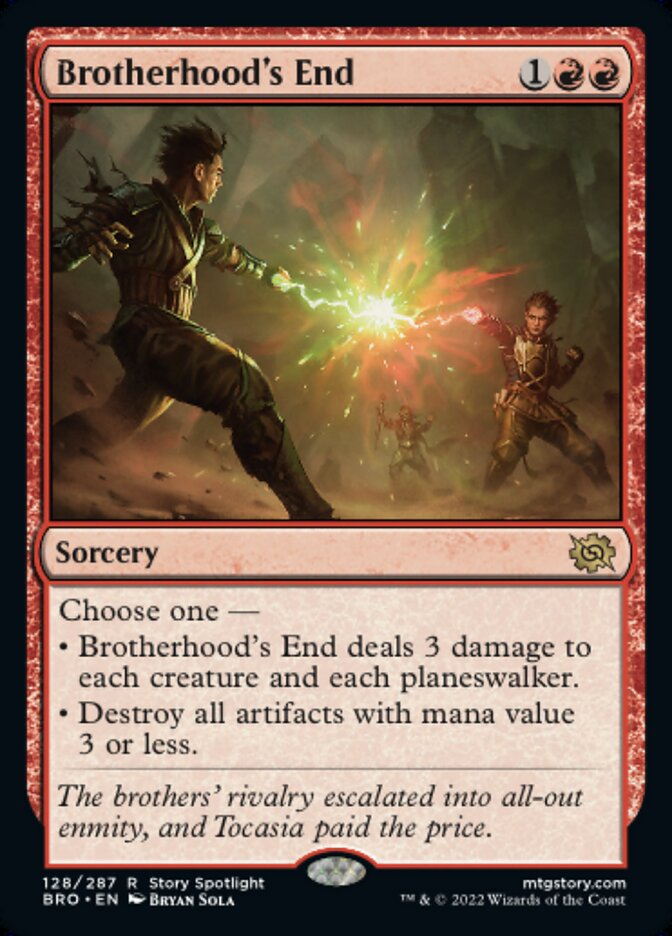
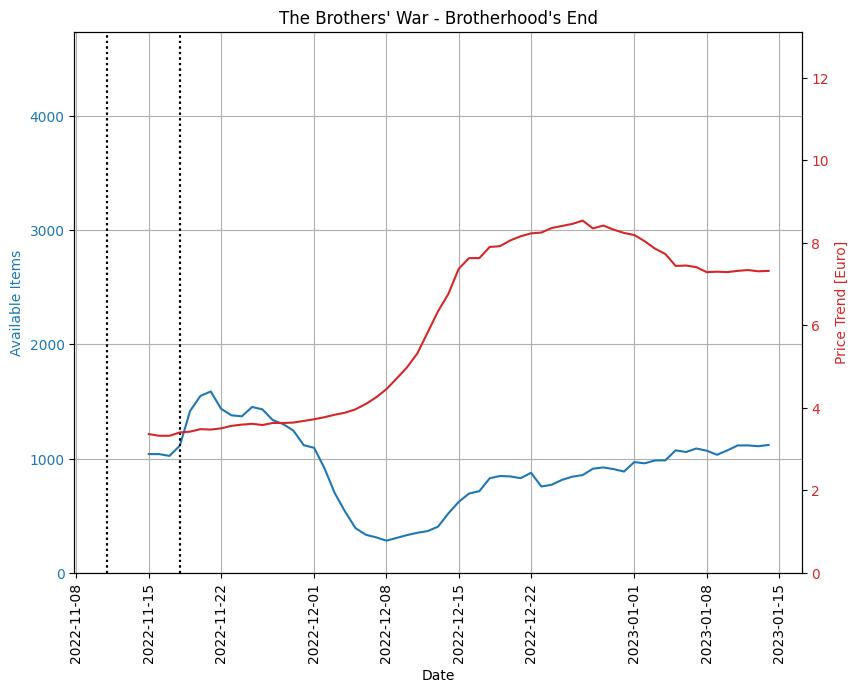
Brotherhood’s End
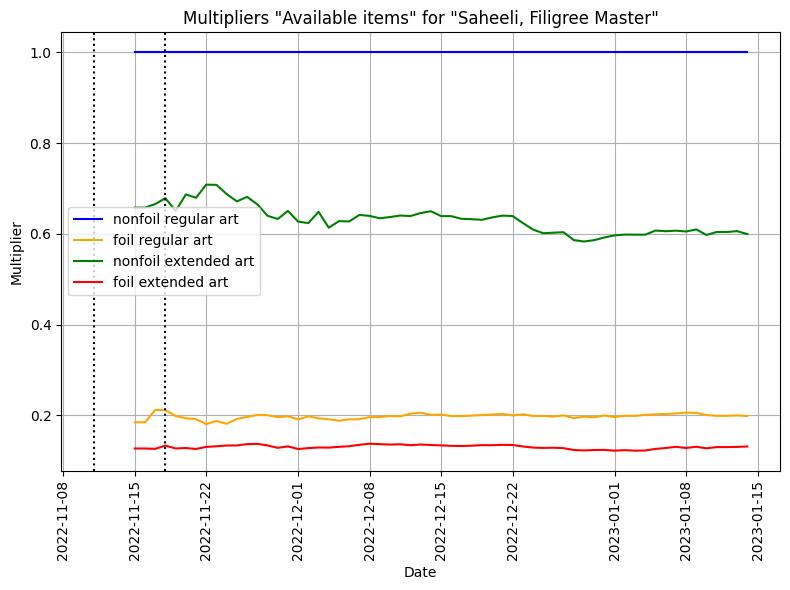
The behaviour of the multiplier for “Brotherhood’s End” stood out. A rather huge bump in the Available Items Multiplier can be observed in the images below.
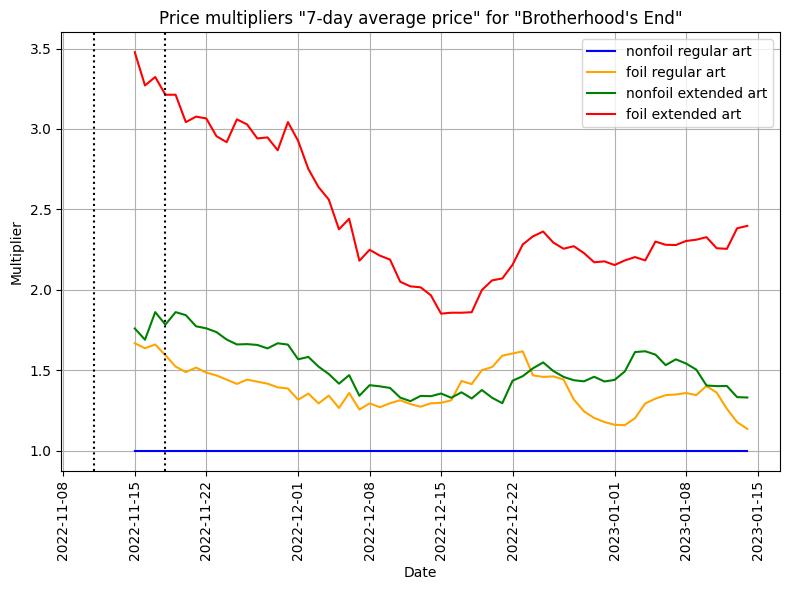 | 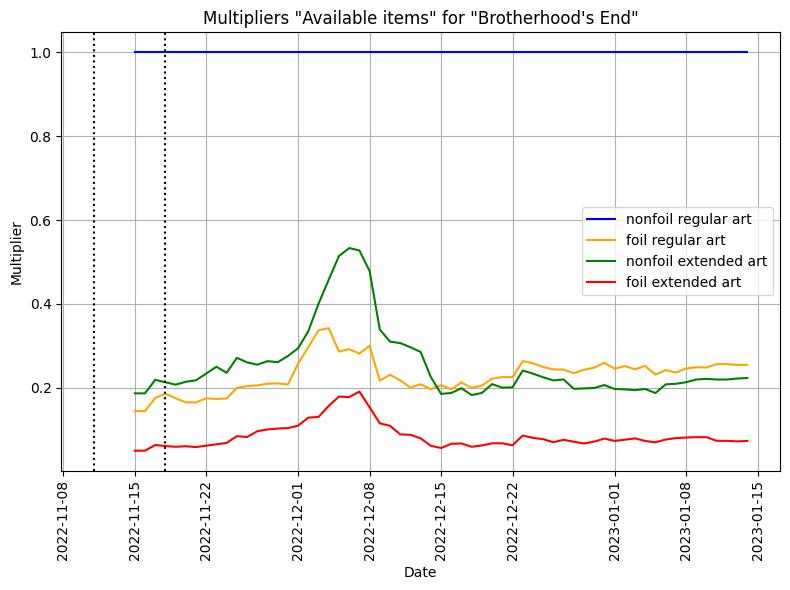 |
In the figure below, the “Available Items” curve shows that people bought the Brotherhood’s End considerably during that period. I have no clear explanation for this bump yet, but it is my understanding that the extended art was, relatively speaking, not picked up as fast as the regular art, meaning that the price for the extended art would have been somewhat behind (or undervalued if you want). Happy to hear your remarks on this one in the comments below!
 |  |
Future Studies
Not yet quite sure if these multipliers will remain the same over a longer period in time. I would certainly like to have a look at these for a set that has “aged” somewhat more. How will these multipliers compare in 1 year, 2 years, 5 years or even longer? I just need to await some more data…
Looking forward to your remarks in the comments below!